Courtesy of the Times Colonist
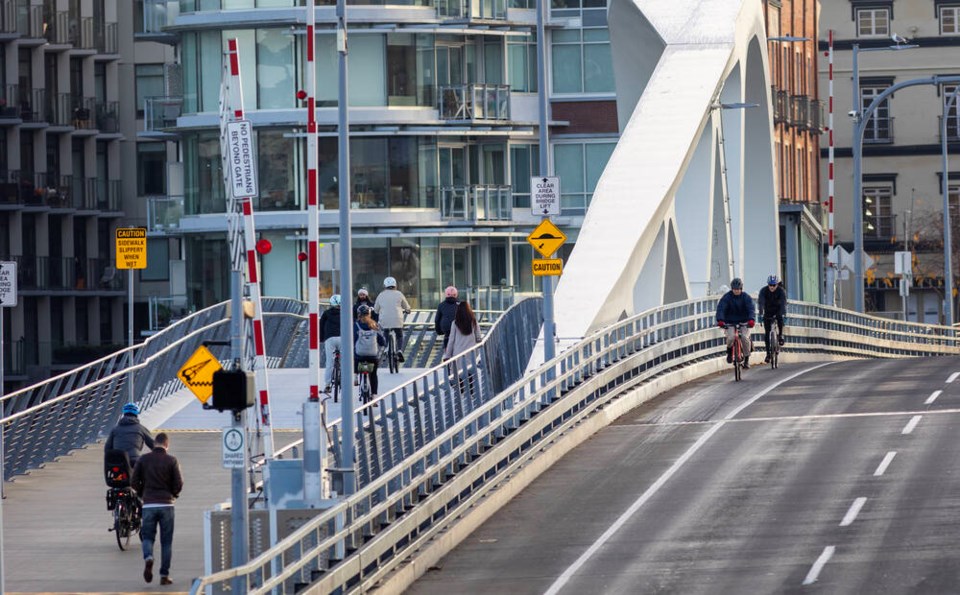
Photo: Cyclists and pedestrians on the Johnson Street Bridge. DARREN STONE, TIMES COLONIST
A commentary by a former Victoria city councillor who is a cycling advocate.
Hardly a day goes by that we don’t see letters to the editor decrying the waste of public money on bicycle facilities that apparently no one uses.
Here are some numbers for those so afflicted with windshield myopia that they cannot see those with whom they share the road.
There are several sources of data observers can go to if they cannot see the many members of our community who travel, frequently enough, by bike.
StatsCan conducts a census every five years and questions Canadians on their travel choices. The last census in 2021, when COVID-19 was disrupting travel habits, still had Greater Victoria well ahead of the country with 5.3 per cent of commuters travelling by bike.
Keep in mind that the census covers a broad geographic area, and cycling levels in core municipalities are much higher.
The Capital Regional District has a couple of tools they use to measure travel in the region.
Their last origin/destination survey in 2022 found that more than 18,000 households are car-free — nine per cent of total residences.
Two-thirds of households have at least one bike, with ownership numbers growing. Other data certainly indicates they are being used.
The same survey showed that eight per cent of trips in the region, 79,000 a day, were by bike or e-bike, beating transit, which carries six per cent of travellers (61,400 a day).
In Victoria proper, nearly 13 per cent of trips were taken by bike, 8 per cent in Saanich. Bike trips were less prevalent in the West Shore and on the Peninsula.
The CRD also has a volunteer count program and easy access to numbers generated by 43 automated counters installed around the region.
Here are some numbers on bike trips from 2025:
A total of 871,426 bike trips across the Johnson Street Bridge. (That’s the trail section only — the counters don’t record trips using the bike lanes on the vehicle deck.)
Pandora Avenue, where cycle tracks are the target of some of those complaining, counts a daily average of more than 1,000 bike trips a day year-round, with 371,464 recorded in 2025.
Fort Street, another target of some letter writers, saw 362,457 bike trips last year, or an average of 993 a day.
Richardson Street in the Fairfield neighbourhood counts 577 bike trips a day, 210,743 total for the year.
Haultain, another street similarly treated to support bike travel, averages 1,195 bikes a day, 436,057 trips for 2025.
In Saanich, along the Lochside Trail, 338,287 in 2025, an average of 927 a day, where the trail crosses Borden and McKenzie.
Our other major trail alongside the E&N rail line shows a daily average of 706 trips a day west of Wilson Street; that’s 257,747 a year, where the trail nears the Esquimalt border.
There are a number of other automated count locations which show positive, if not robust, numbers of bike trips. Much more of our road network where little or no data on bike trips has been recorded, but to be sure, cyclists are out there.
I expect we will continue to see more letters with the claim that our cycling networks are a poor investment, used, if at all, by a few of our friends and neighbours.
But truthfully, the facts are stubborn, and the data tells a different story.